Documentation
Learn how Polypane improves your workflow
Configuring WebStorm to work with Polypane
You can configure WebStorm to open Polypane when starting a debug session or as a live reload target. This allows you to debug your code in WebStorm and see the result in Polypane.
Step 1: Adding Polypane to the list of browsers
In WebStorm, go to your Settings > Tools > Web Browsers and previews. Click the + button at the top of the list of browsers to add a new browser.
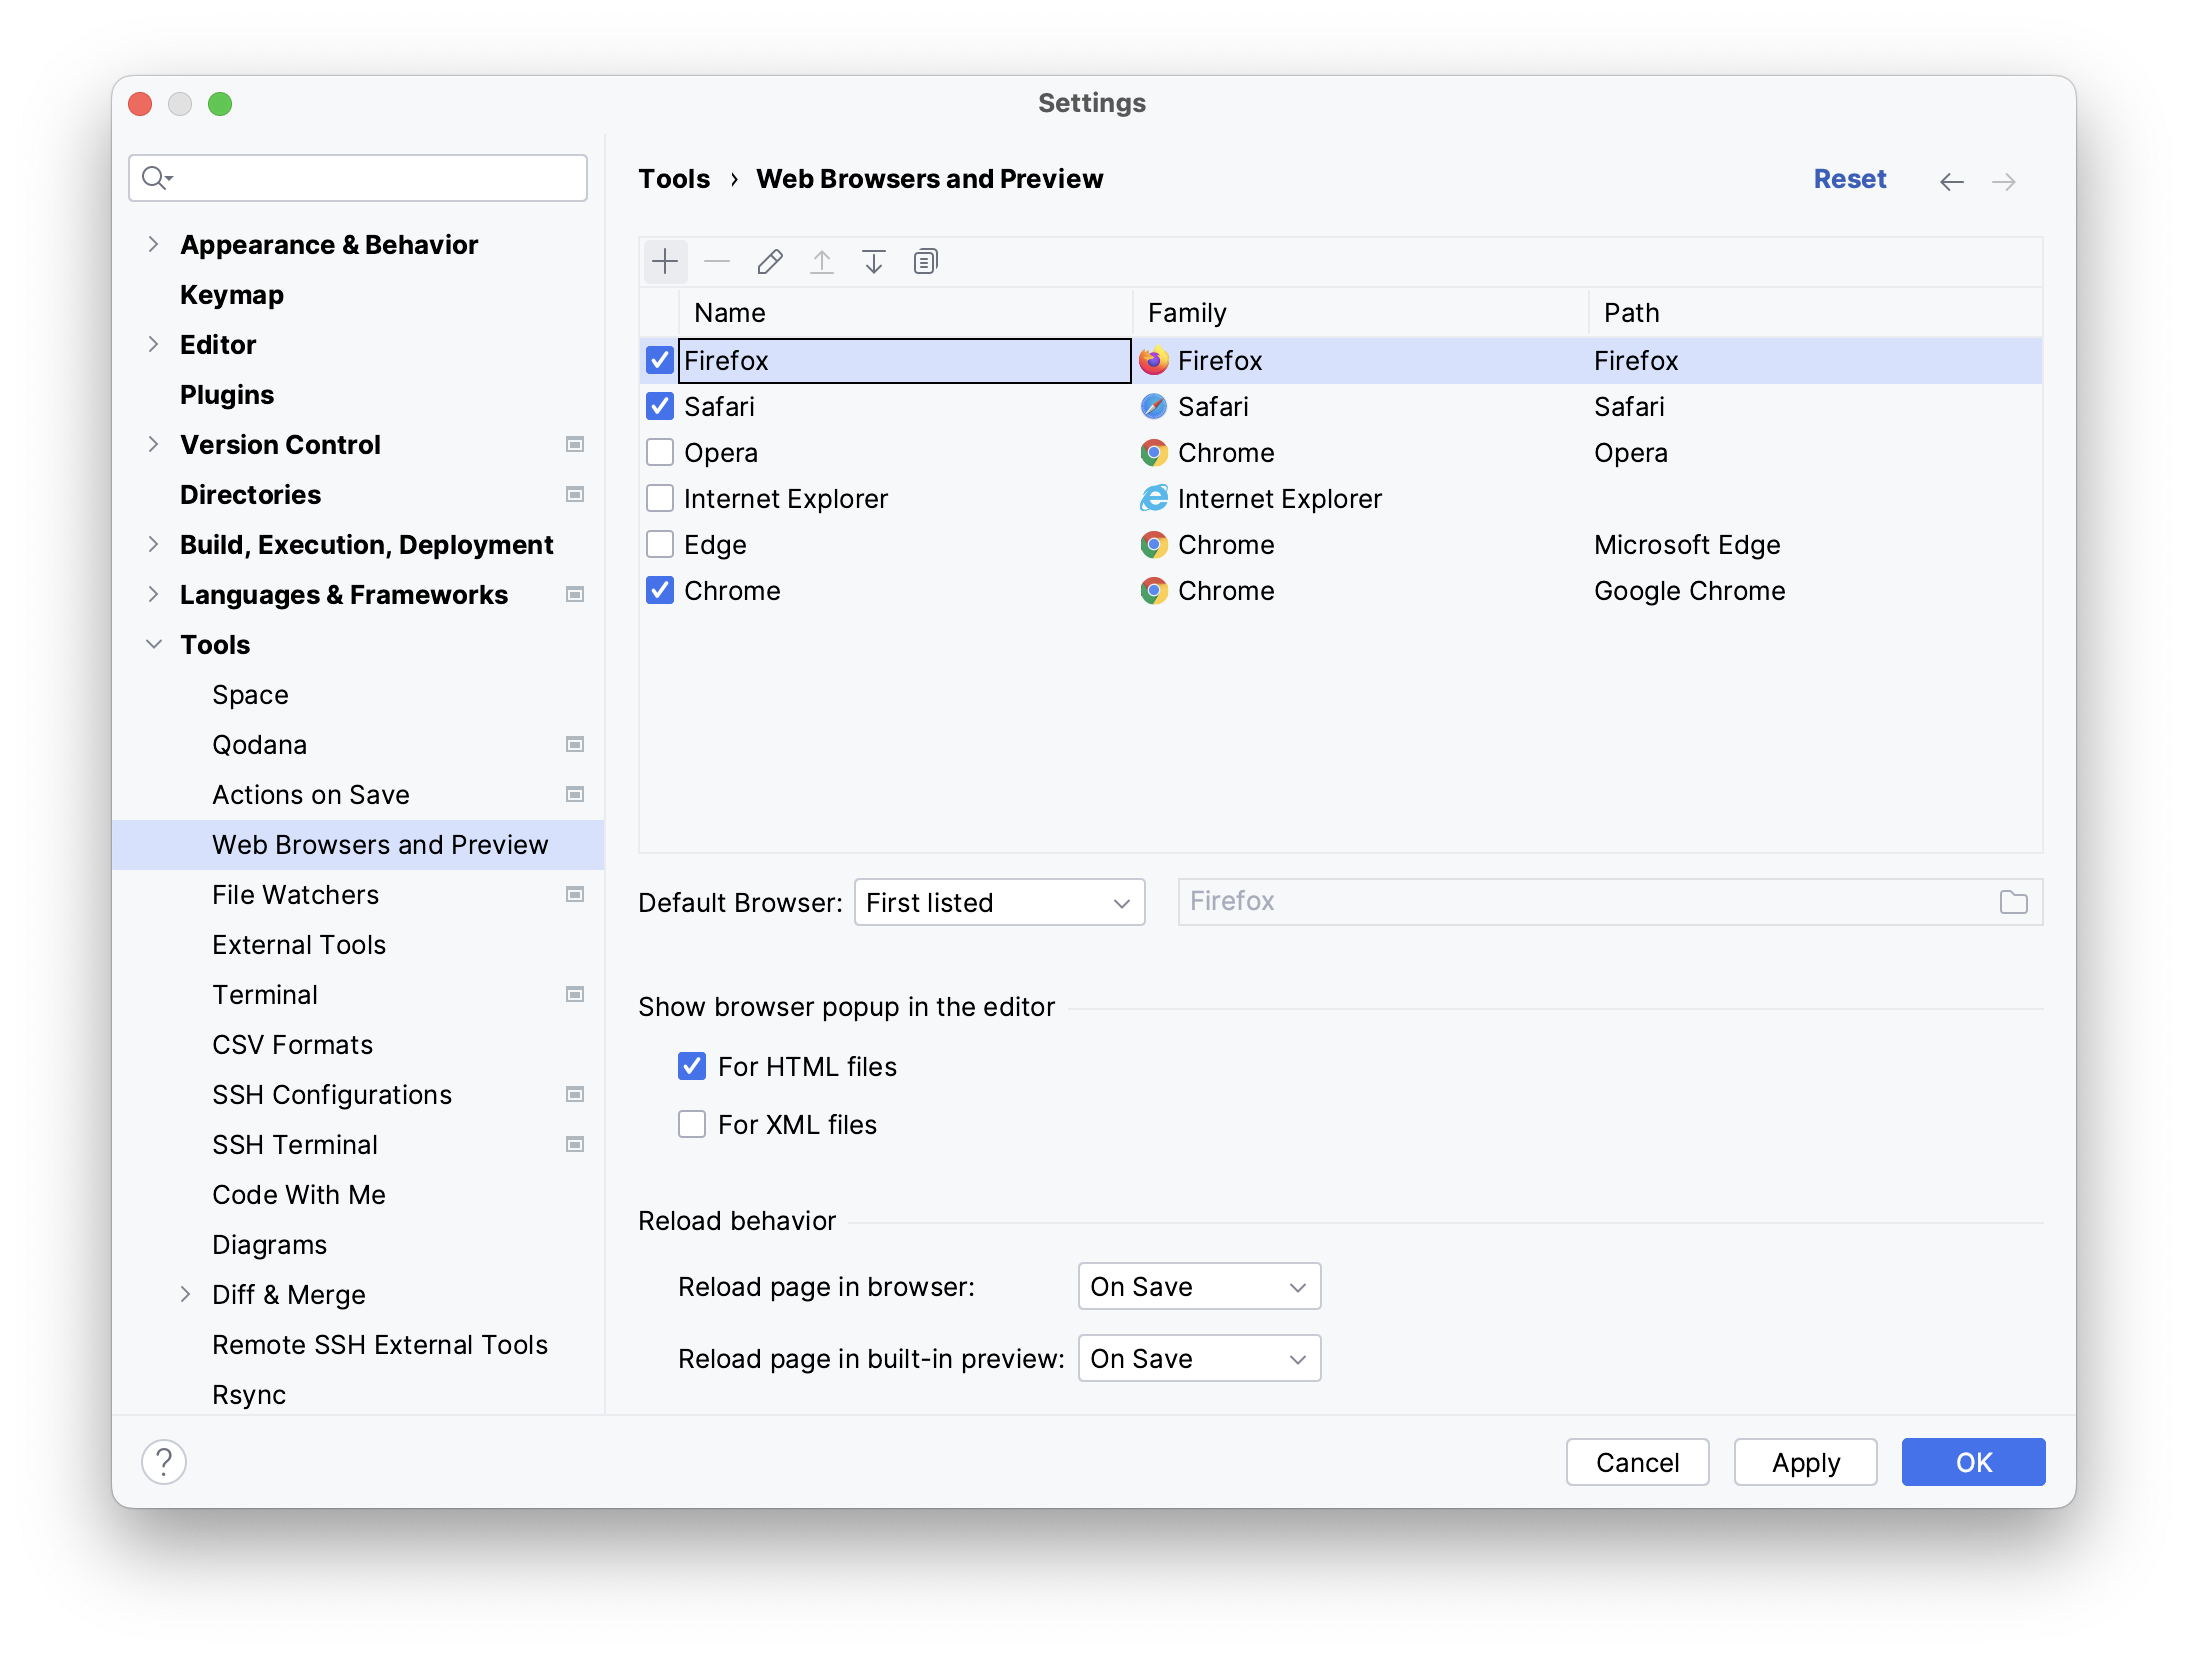
Name it Polypane, set the family to "Google Chrome" and set the path to the Polypane executable. The path differs per OS:
- Windows:
C:\Program Files\Polypane\Polypane.exe - macOS:
/Applications/Polypane.app/Contents/MacOS/Polypane - Linux:
polypane
If you want it to be used as the default browser, drag it to the top of the list.
Step 2: Configuring it
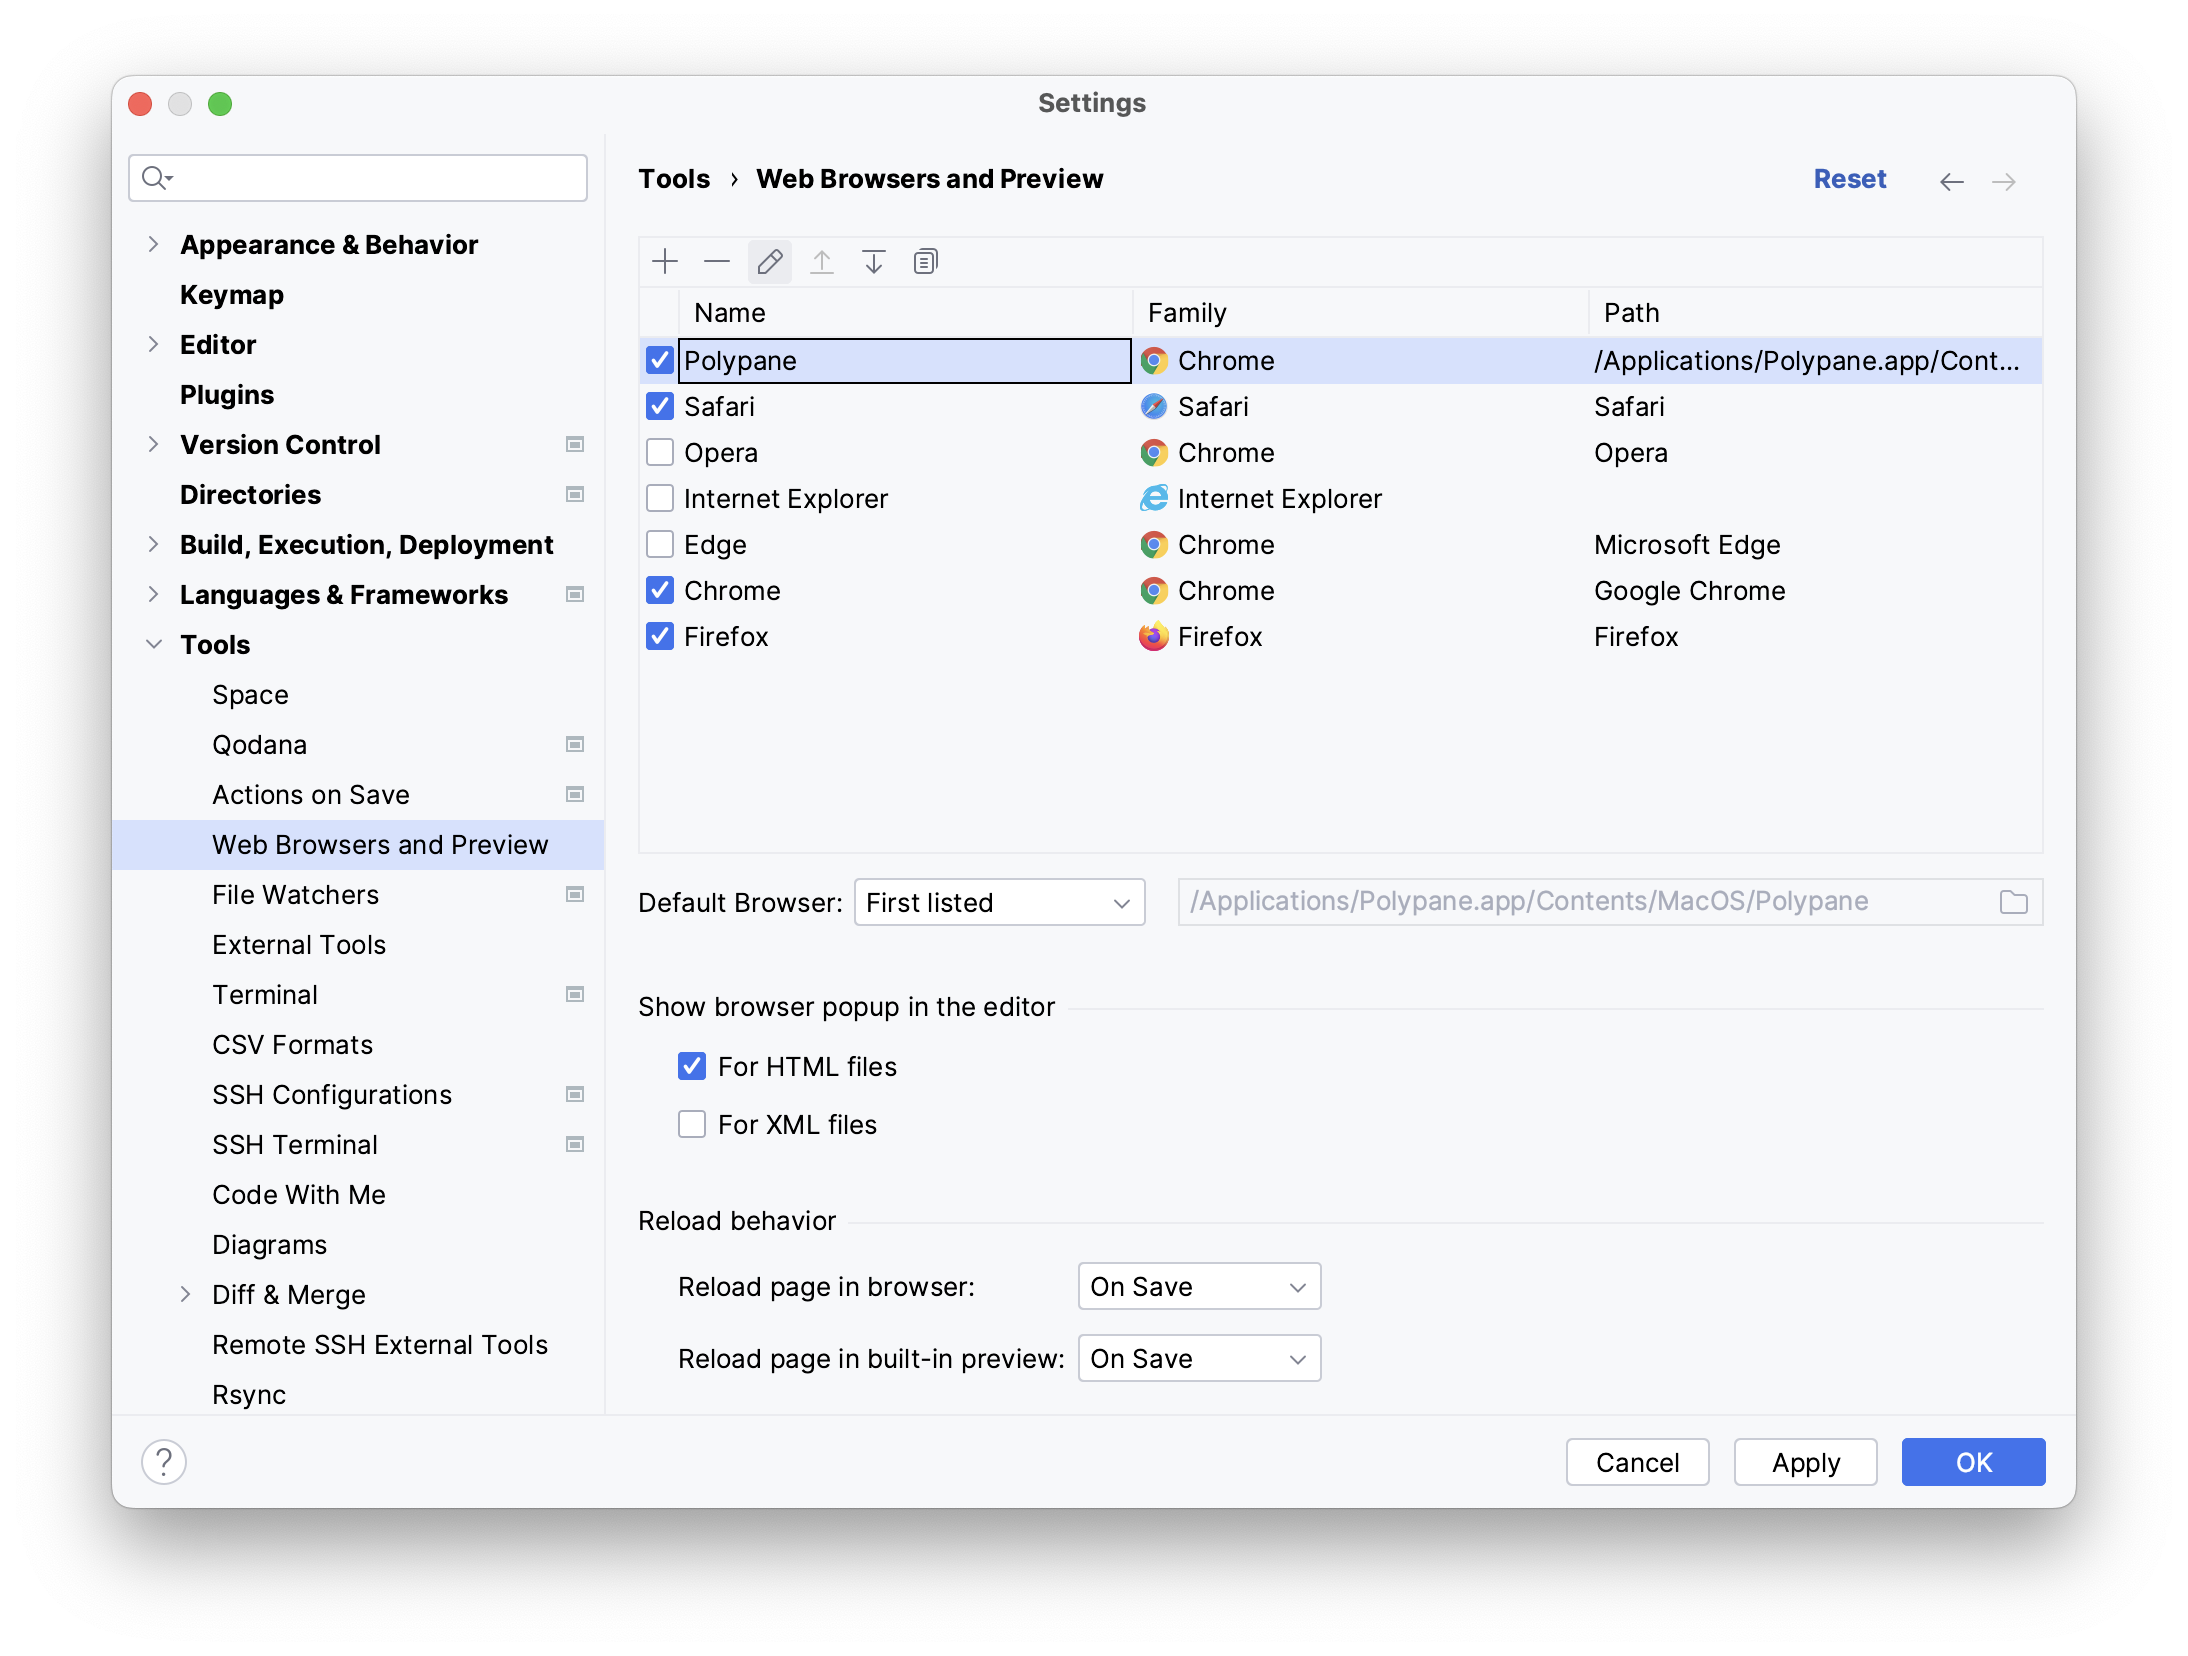
With Polypane selected in the table, click the Pencil icon above it. This will open the configuration screen.
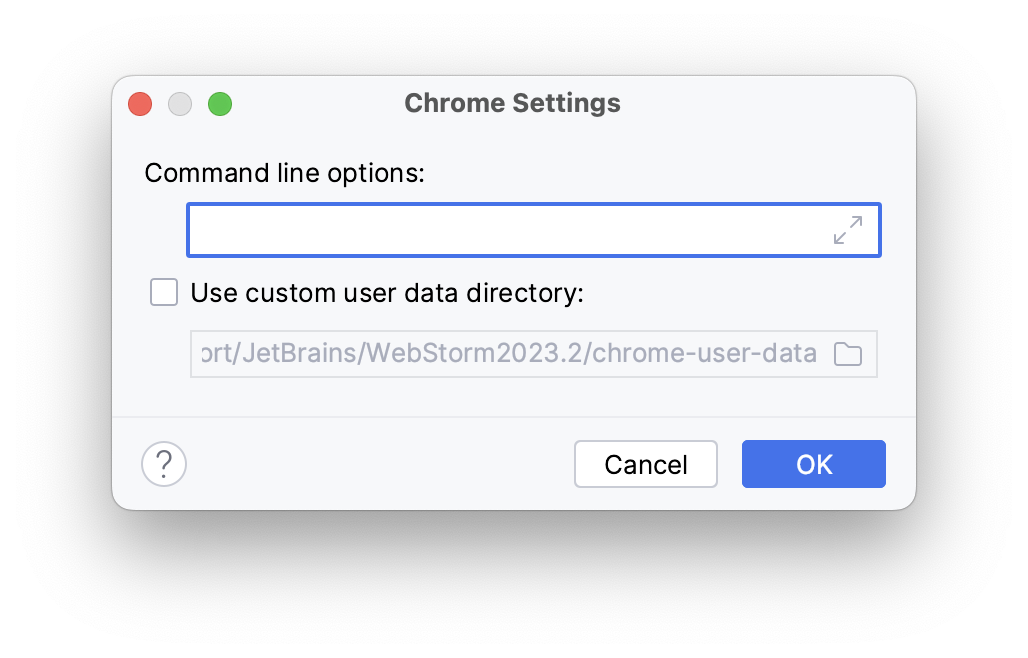
Check the "Use custom user data directory:" checkbox and set the path to the user data directory of Polypane. The location of this data directory differs per OS:
- Windows:
%APPDATA%/Polypane/ - macOS:
~/Library/Application Support/Polypane/ - Linux:
~/.config/Polypane/
Once selected, press "OK", and close the settingds window
Step 3: Setting up a debug session
Right click your (npm/other) dev script in the sidebar and select "Edit [name] Settings...".
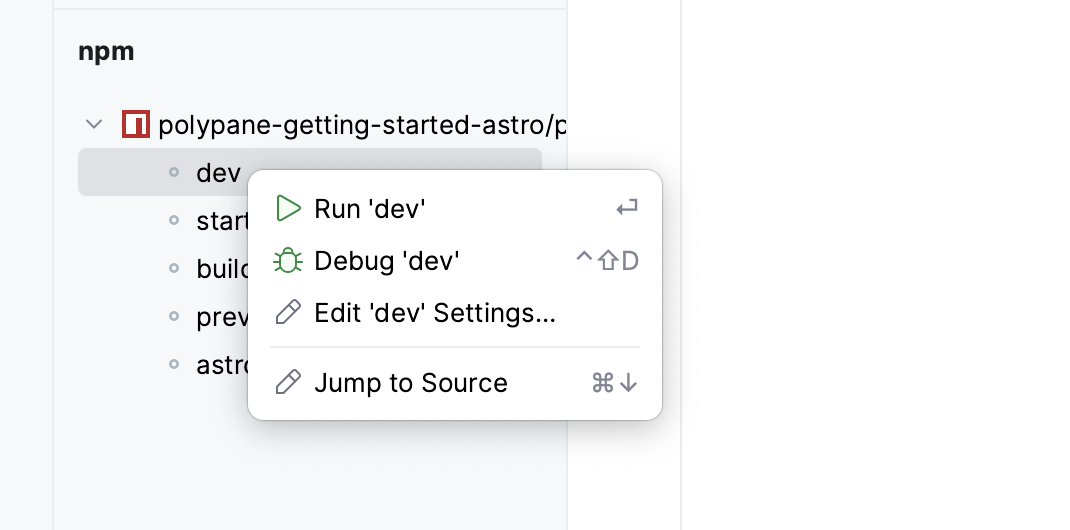
This will open the configuration:
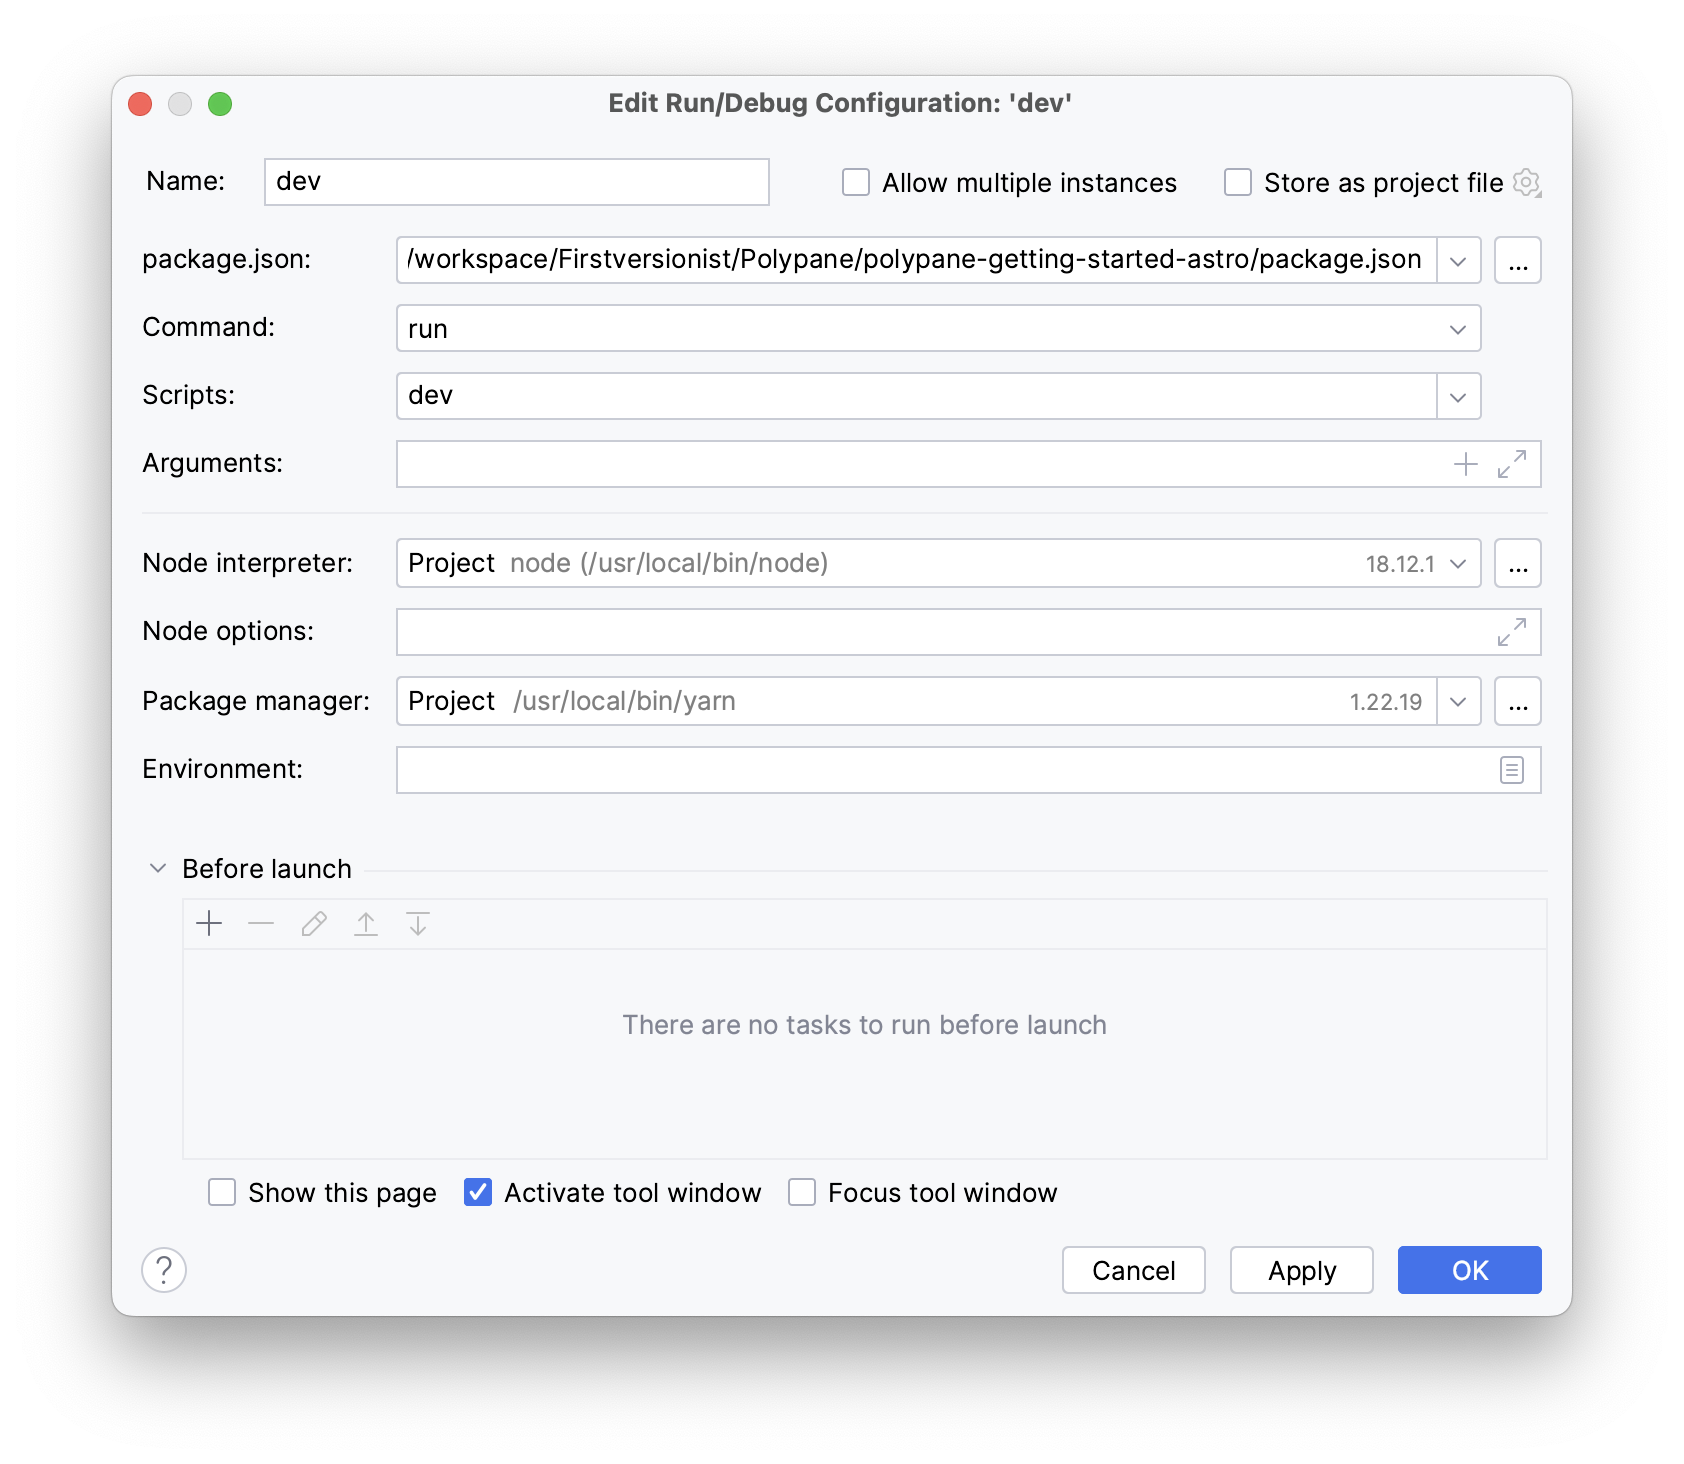
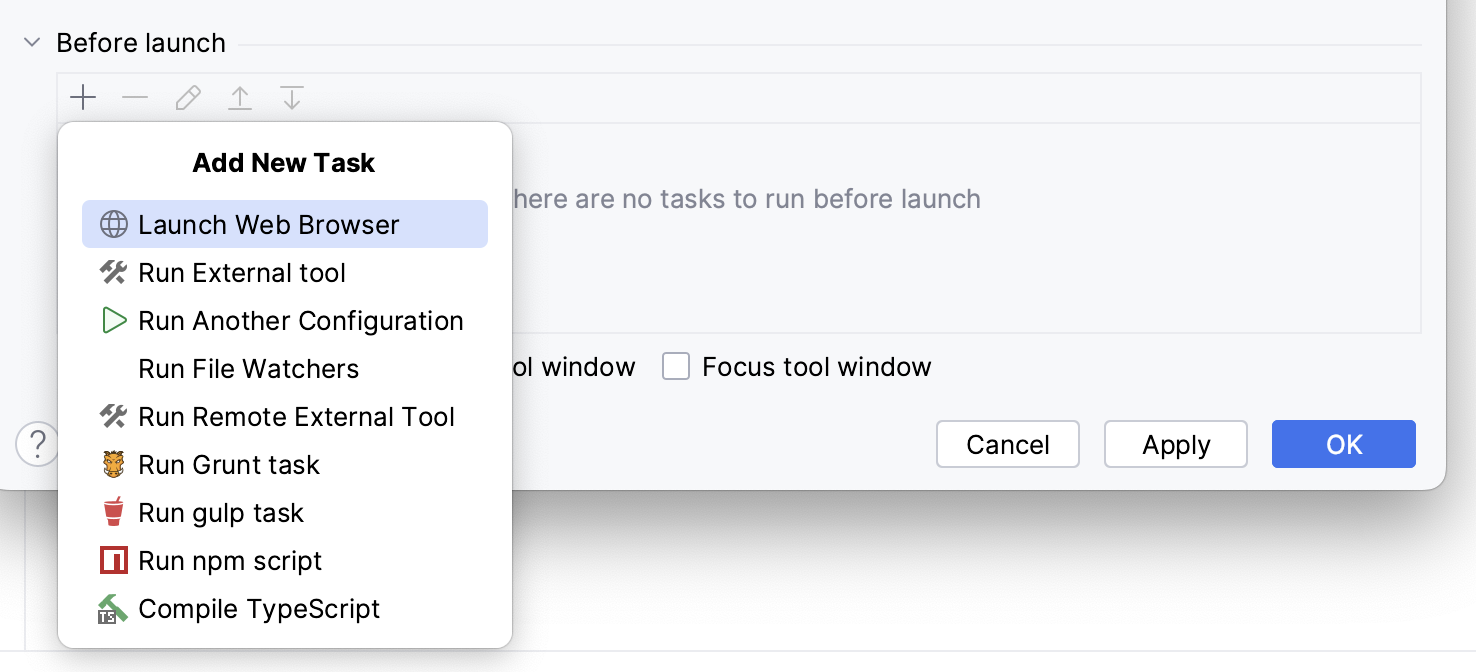
In this configuration panel, click the + below "Before launch" and select "Launch Web Browser".
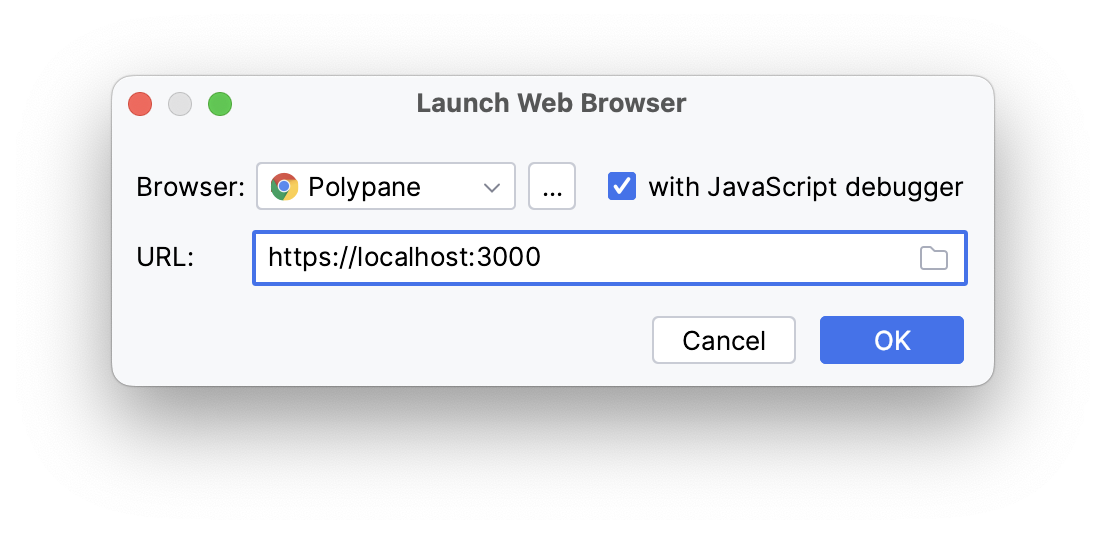
In the browser dropdown select "Polypane" (or use Default if you set Polypane as the default browser in webstorm 1). Fill in the URL your server launches at, for example https://localhost:3000. If you want to enable remote debugging, check the "with Javascript debugger" checkbox.
Step 4: Reconnect JavaScript debugging
Once Polypane has started, you might not see your URL yet, and this is because we can't yet retrieve the URL from WebStorm. To remedy this, click the "Rerun '[name]' button in your WebStorm debug console or press ⌘ R in WebStorm and the URL in Polypane will update. You can now debug your code in WebStorm and see the result in Polypane.

Have a question about Polypane?
Contact us any time though chat, Slack or our contact form:
Contact SupportBuild your next project with Polypane
- Use all features on all plans
- On Mac, Window and Linux
- 14-day free trial – no credit card needed
