Documentation
Learn how Polypane improves your workflow
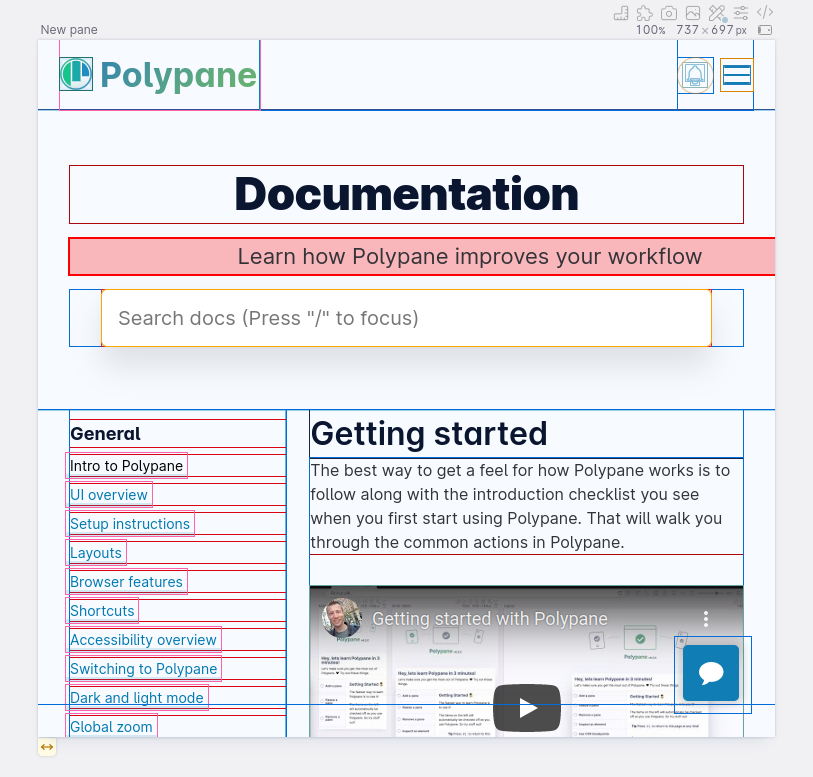
Layout debugging
With the shortcut ctrl/cmd d you can quickly toggle layout debugging in your panes. This adds outlines to all the HTML elements on the pages letting you quickly analyze the HTML structure and find out which elements are causing layout issues.
It's like adding * { outline: red}, except much faster with different colors for different elements and support for pseudo elements.
This debug tool can also be applied on a single pane using Debug tools, where it's called "Layout debugging".
Indicator in address bar
When layout debugging is active, a small indicator will appear on the right in the address bar. This way you can quickly see if the global layout debugging is active.

Click the indicator to disable layout debugging.
Detecting horizontal overflows
Elements that cause a horizontal scroll bar/horizontal overflow are highlighted in red, making it easy to spot them.
Read more about detecting horizontal overflows.
Have a question about Polypane?
Contact us any time though chat, Slack or our contact form:
Contact SupportBuild your next project with Polypane
- Use all features on all plans
- On Mac, Window and Linux
- 14-day free trial – no credit card needed

